



Hybrid — docks + virtual stations
 Cities currently operating
 Bikes in active service
 Rides since launch
 Countries
Capital-wide mechanical system, one of the highest rotation rates per bike in Europe. The tender called for a service that would fit local topography, weather, and ridership patterns — not a catalogue product dropped on the map.

Dock-based system

Sub-zero operations required

Unified app, billing, and fleet balancing
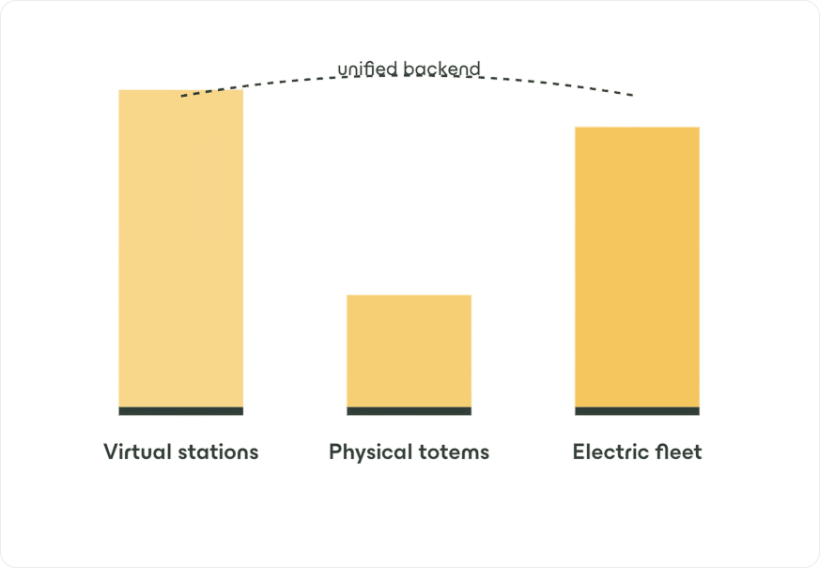
We selected a 100% virtual-station architecture to avoid costly civil works across three municipalities, and paired it with physical totems and racks at high-traffic nodes to keep the system legible to first-time users.
We believe in transparency: you have the right to know exactly how your data is used, and to control it.
4,000 of 5,300 bikes are electric, prioritised on routes with elevation over 20m. Winter operations are sub-contracted to a local partner with a proven Baltic track record.
The most operationally significant finding was around elevation-aware deployment. Our predictive model, trained on the first six months of GPS trip data, correctly identified the Chetre–Waasaz corridor as a net-downhill commuter flow in the morning and net-uphill in the evening. We now pre-position 18% more e-bikes at the coastal end of this corridor at 07:00, reducing redistribution runs by 3.4 per day.
Battery degradation in the Baltic winter was our second concern. At -12°C, PBSC cells lose approximately 22% of nominal range. We compensate by lowering the minimum deployment threshold from 40% to 30% battery state, and by positioning the depot van routes to prioritise sub-35% bikes before 06:30. Fleet uptime in December 2024 was 97.2% — above contract SLA.



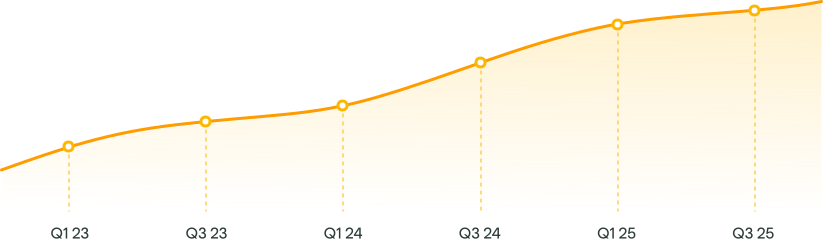
*Monthly mechanical fleet rides vs electric fleet average from 2022 to 2026.
Get in touch. We’ll bring the operational data and the honest answers.
Let's talk

Short Sub-zero ridership is real. Here is how we keep 92% of the fleet active through the dark months — including studded tires and depot scheduling.

Short A staged migration plan, a hybrid e-/mechanical fleet, and what the rebalancing data taught us about elevation-aware deployment. A staged migration plan, a hybrid e-/mechanical fleet, and what the rebalancing data taught us about elevation-aware deployment.